by Ana Pires Fernandes
Analysing Publicly Available Data Can Help Inform Strategic Tech Choices In The Cloud
According to recent research, firms that excel in digital transformation are 26% more profitable, generate 9% more revenue from their physical assets, and achieve 12% higher market valuations than other large firms in their industries. The backbone of a holistic end-to-end digital transformation is moving systems to the cloud. Tech-savvy businesses cited easier deployment (49%), scalability (48%), faster implementation speed (44%), automatic updates (37%) and real-time visibility (34%) as the main benefits of choosing a cloud service which belongs to, and innovates, the state-of-the-art.
Keeping up with the latest advances in cloud technology is imperative for businesses but this can be a lengthy process which requires expertise and data analysis. It is insufficient to rely on any one single metric to compare technology and it is challenging to perform this analysis at scale and in an automated manner. For this reason, this blog examines the use of Python to measure the popularity of cloud providers by multiple metrics using the public APIs of two diverse data sources, Twitter and Stack Overflow (a website for developers to post technical questions). This data has been processed using Python with the Pandas package, and visualised using Plotly. While the focus is on cloud providers, this process can scale to monitor trends in any technology.
Cloud Providers on Stack Overflow
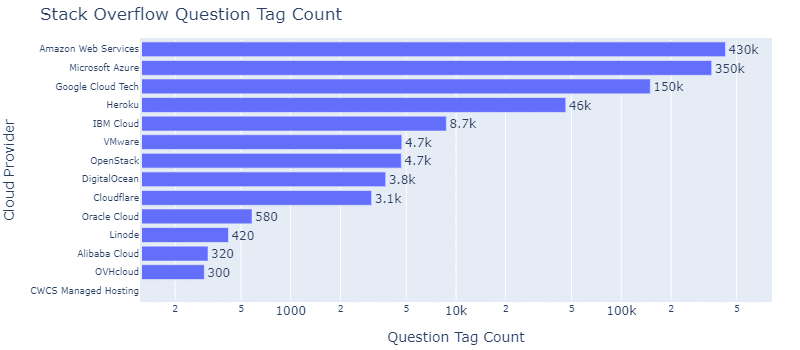
Figure 1 highlights the popularity of each cloud provider on the Stack Overflow website as measured by questions tagged by cloud provider. All tags relevant to a cloud provider were considered. As may be expected, Amazon Web Services, Microsoft Azure and Google Cloud are by far the most discussed on Stack Overflow, while Heroku and IBM have a notable presence but are some way behind.
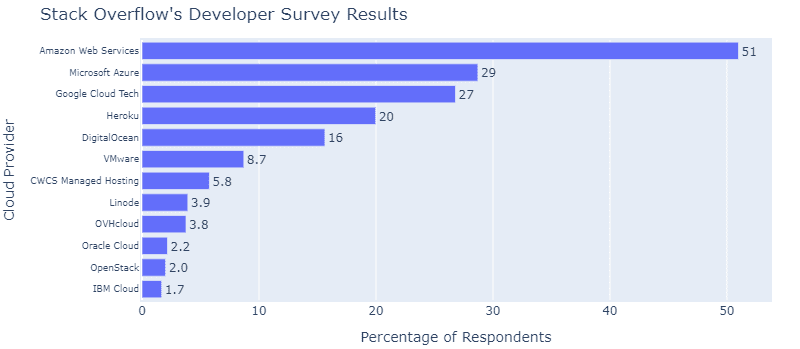
Figure 2 showcases the results of the popularity of each cloud provider from the annual developers’ survey conducted by Stack Overflow with 56,553 participants from all over the globe. The results in Figure 1 are corroborated by the results in Figure 2 for the first 4 most popular cloud providers. Interestingly, IBM Cloud is the 5th most tagged in questions but ranks last in the developers’ preference survey.
Cloud Providers on Twitter
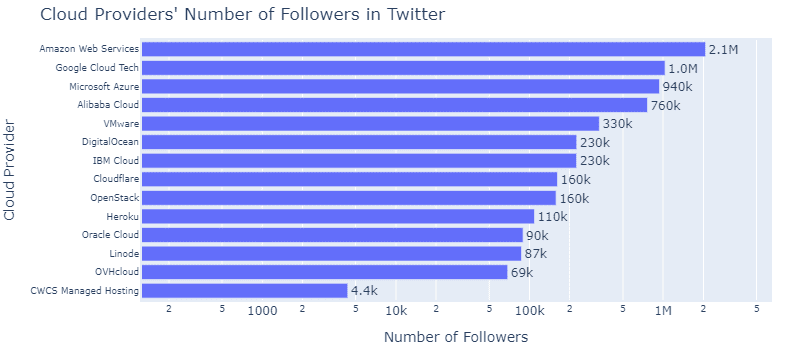
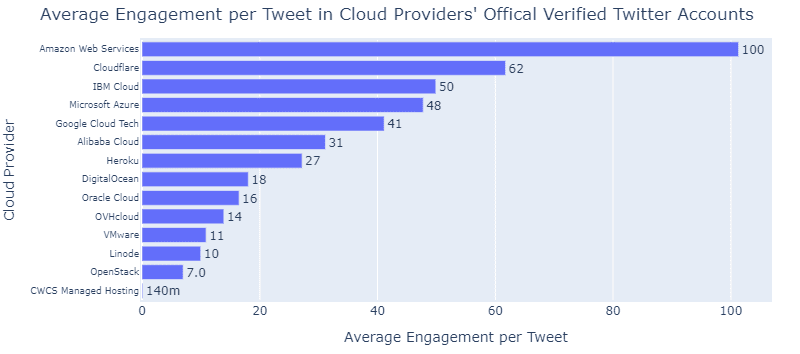
Figure 3 and Figure 4 paint a comprehensive picture of cloud providers Twitter popularity using two metrics; the number of followers of their main Twitter account and the average tweet engagement defined as the average number of retweets, replies, quotes and likes of their last 250 Twitter posts. Once again, Amazon Web Services has an overwhelming lead in both metrics. As expected, average engagement per tweet closely follows the number of followers each cloud provider has. However, there are a few exceptions to this. Cloudflare ranks 8th by number of followers, yet it amasses an impressive level of engagement per tweet, ranking 2nd by that metric, and VMware has a comparably low tweet engagement for its number of followers. In general, the smaller cloud providers by Stack Overflow metrics are also the smaller providers by Twitter metrics as evidenced by OVHcloud, Oracle Cloud, Linode and CWCS Managed Hosting. Notable exceptions here are Alibaba Cloud and Heroku. Alibaba Cloud has comparably high average tweet engagement and ranks 4th in followers, while despite being popular amongst developers as measured by Stack Overflow metrics, Heroku does not seem to have a comparably large number of Twitter followers although it does better by average tweet engagement.
Combining Cloud Providers Twitter and Stack Overflow Metrics
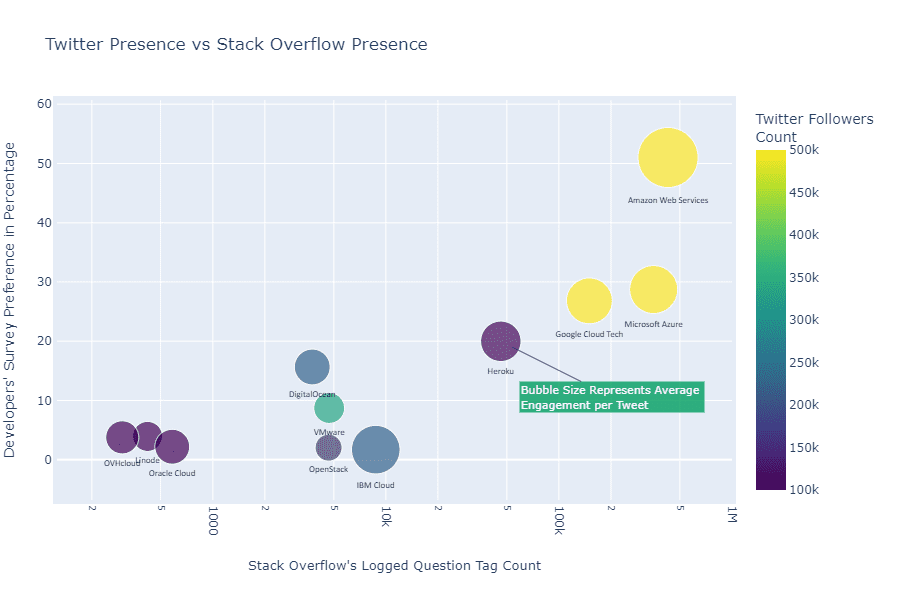
Figure 5 combines all Stack Overflow and Twitter metrics in a single visually accessible chart for comparison. Besides IBM Cloud’s unusually large Tweet engagement, VMwares unusually low tweet engagement, and Heroku's unusually low number of Twitter followers, when compared to their performance on Stack Overflow the data seems to be consistent across cloud providers and data sources. The leading cloud providers are Amazon Web Services, Microsoft Azure, and Google Cloud Platform, with Amazon Web Services leading by a high margin by all metrics. The smallest providers as measured by all metrics are OVHcloud, Linode and Oracle cloud. There is a clear pattern of darker colours (indicative of a lower number of followers in Twitter) and smaller bubble size (indicative of a lower engagement per tweet) in the bottom left of Figure 5. Similarly, there is a pattern of lighter colours (indicative of a higher number of followers in Twitter) and a bigger bubble size (indicative of a higher engagement per tweet) in the top right.
This analysis has shown that there are benefits to examining data from multiple sources when measuring the popularity of technology and that each data source tells its own story and suffers its own biases. By automating the collection of data from multiple sources with Python it is possible to obtain versatile results which offer a coherent and comprehensive analysis of cloud provider popularity. This methodology is extendable to a wide range of technology.
Ana Pires Fernandes is studying a BA in Politics, Philosophy and Economics at the University of Manchester and is a Q-Step Data Analyst Intern at Opsmorph.
