by Olivia Hague
Transport Usage has Changed Dramatically During the Covid-19 Pandemic
As a result of lockdowns, social distancing restrictions, and anxiety concerning infection, use of different modes of transport changed significantly over the pandemic. The UK experienced an overall shift to an increased use of cycling and walking during lockdowns as people attempted to avoid public transport due to the increased spread of the virus in confined spaces. This change also accelerated the increase in low-carbon transport and has thus been of particular interest to both local and national governments as the country attempts to reduce its environmental impacts, in response to the climate crisis. Nationally, the government have recently committed further investment of £175 million in cycling and walking infrastructure. Sustainability as a central goal of national transport policy is further evidenced by the theme running through the main goals of Innovate UK’s Transport Vision 2050.
At the local level, many councils have used the travel impacts of lockdowns as opportunities to reimagine their public spaces, with increasing pedestrianisation of cities and towns and greater investment into cycle routes and footpaths. Councils, including Croydon and Manchester, among others, are committed to the implementation of Low Traffic Neighbourhoods. Such changes are likely to have majority support with a recent survey conducted by Kantar Media reporting that 65% of the public support the ‘relocation of road space to cycling and walking in their local area’ and 78% supporting measures to reduce road traffic. Local businesses have been able to benefit from access to road space and across the country many local councils have decided to keep the pedestrianisation of areas of roads which are now used by cafés, restaurants and bars as additional seating space, a move which was originally made to enable businesses to safely serve customers in open spaces. These spaces have benefitted the community, helping to reduce city pollution, and creating more community spaces for the public to enjoy. Some businesses have also benefiited from increasing the number of customers they can serve due to the additional seating. But while there are obvious benefits to these changes, there are also some concerns that with the pandemic people are not travelling into cities and towns as much and that spending in shops as well as on public transport is reduced. It is against this backdrop that local government will wish to carefully monitor data on transport changes going forward.
The data in this blog has been collected from publicly available government statistics, published by the Department for Transport and the Office of Rail and Road. This data has been processed using Python with the Pandas package, and visualised using Plotly.
Changes in Transport Mode Usage
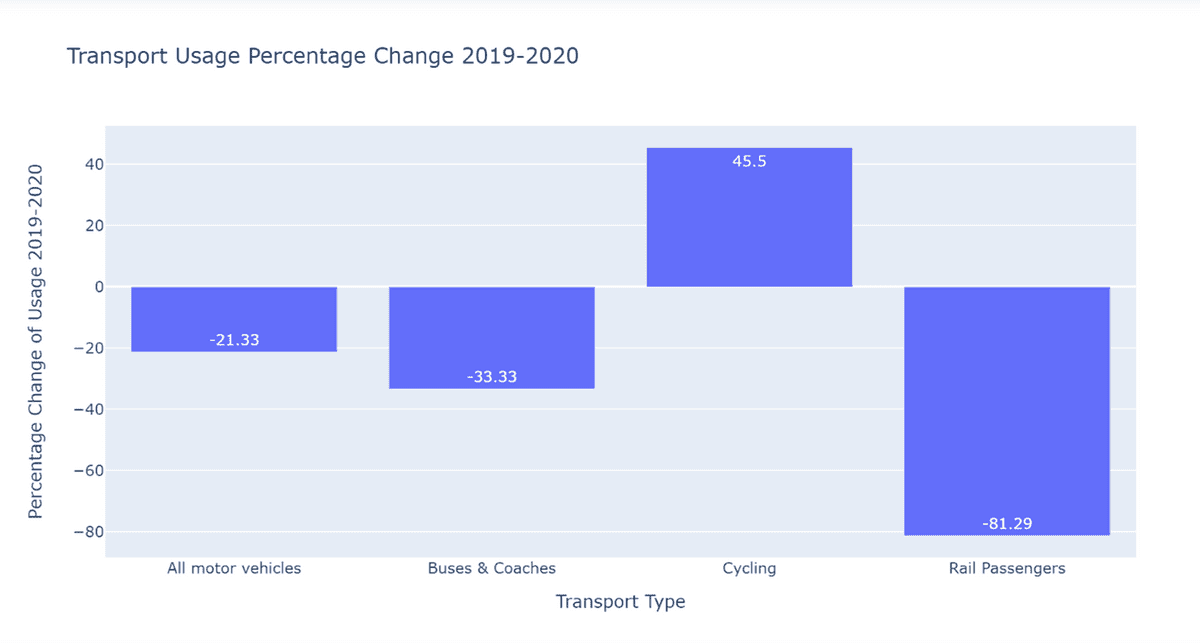
Figure 1 visualises the percentage change of usage in different modes of transport in Great Britain from prior to the pandemic in 2019, to during in 2020. The most significant change can be seen in rail usage, with a percentage drop of 81.29% among rail passengers which has had significant financial consequences for the rail industry. Motor vehicles also experienced a drop, which was likely the result of lockdowns as people were making fewer journeys than normal. Bus and coach use fell more significantly than all motor vehicles, with public transport discouraged to help prevent the spread of disease. Cycling however, saw a 45.5% increase, attributed to lockdowns and social distancing measures that encouraged people to use modes of transport that were outdoors to prevent the spread of infection.
Changes in All Motor Vehicle Usage by Region
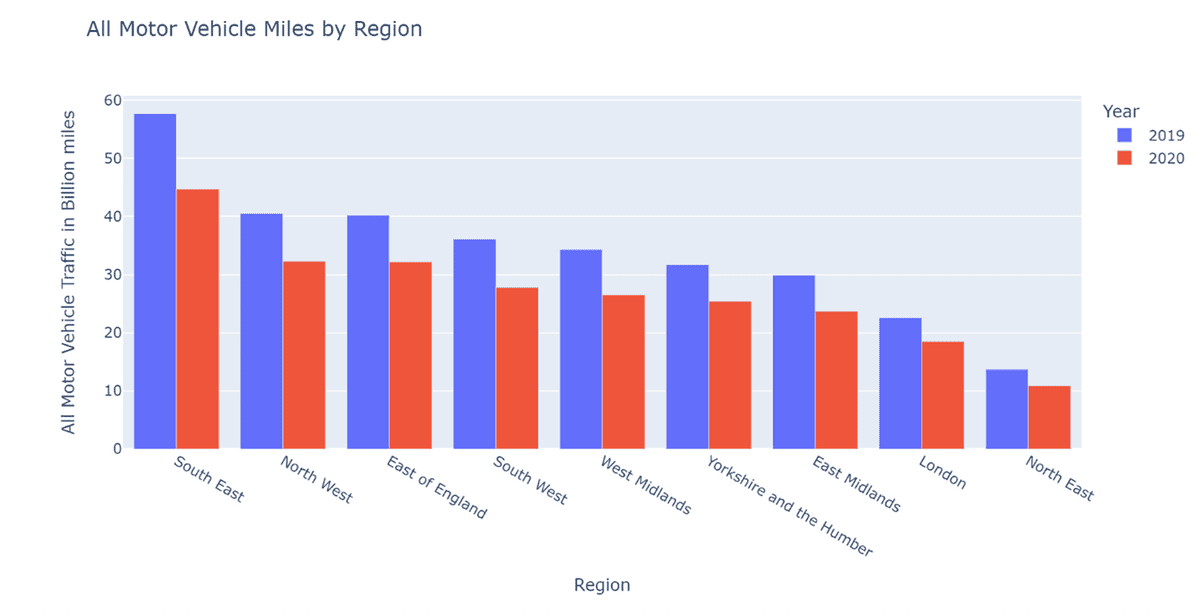
Figure 2 shows the regional breakdown of all motor vehicle traffic, measured in Billion miles, from 2019 and 2020. The graph shows a reduction of motor vehicle usage across all regions between 2019 and 2020, with the most significant reductions in the Southeast where motor vehicle usage is highest both prior to and during the pandemic. The Southeast region has the highest traffic, accounting for 16% of all national traffic in both 2019 and 2020, with three of the five local authorities with the highest traffic levels being in the region. In normal times, the region sees large amounts of traffic coming in from Europe, through the nation’s main ports hosted in the region. The Southeast’s high traffic volumes also correlates with its large number of roads and motor ways.
Changes in Bus and Coach Usage by Region
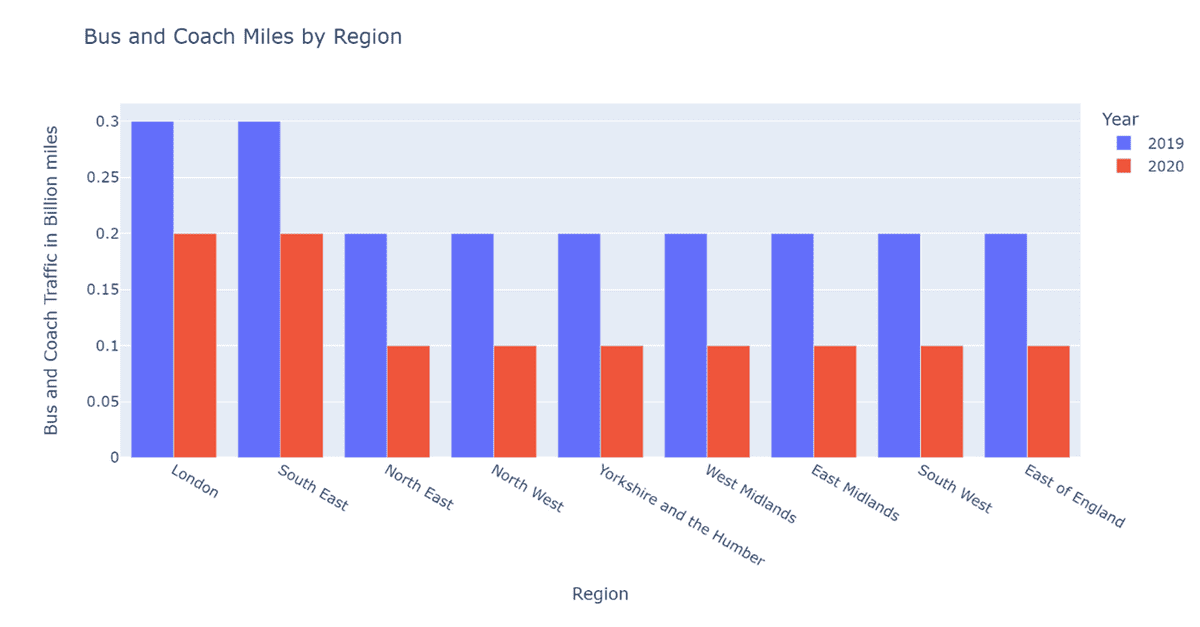
Figure 3 shows the miles travelled by busses and coaches in 2019 and 2020, by region. The graph shows a drop in bus and coach usage across all regions, with all regions except London and the Southeast seeing a fall by 50%. This fall can be largely attributed to the lockdowns and social distancing measures that have encouraged people away from using public transport, due to the risks of infection in closed crowded spaces. The fall in bus usage has been a particular concern to local governments due to the revenue this ordinarily provides for the transport sector, particularly in the Southeast and London. Public transport usage is yet to return to pre-pandemic levels, with the continued increase of people working from home, compared to before the pandemic. Many local governments are therefore keen to encourage greater usage of busses, with policies in Manchester, amongst other places, focussed on improving the routes and getting people back into cities.
Changes in Cycling by Region
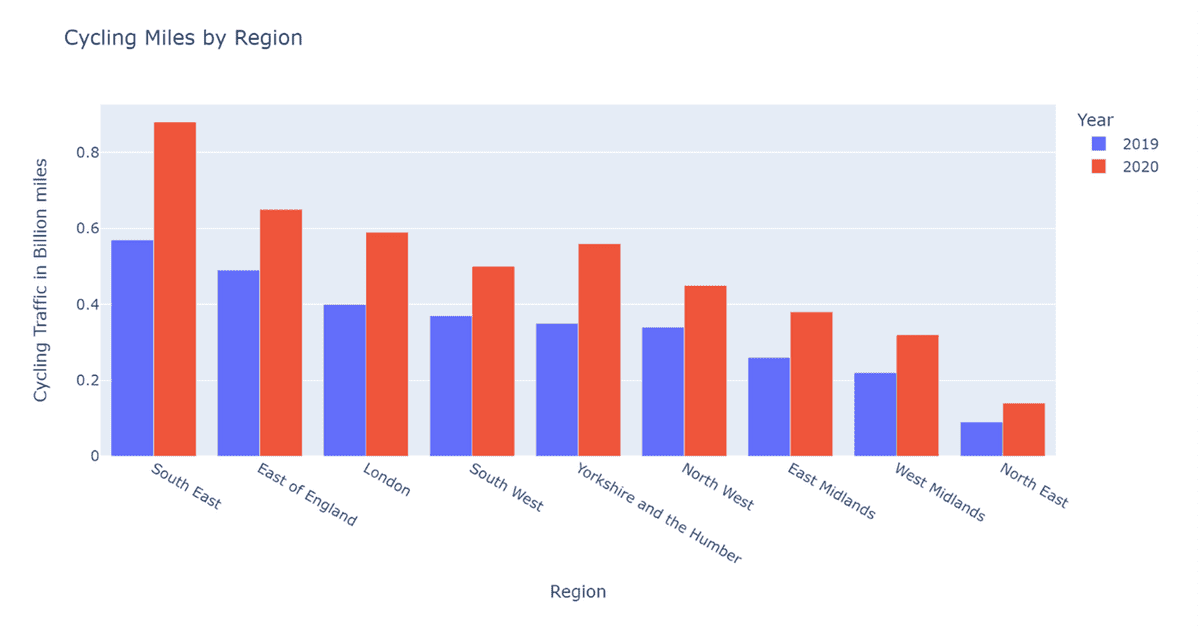
Figure 4 shows the percentage increase in unemployment by sector against the 2019 sectoral average baseline. In shows the increase in cycling across regions between 2019 and 2020, with the Southeast and Yorkshire and the Humber regions seeing the highest rise. This increase of cycling can be attributed to the lockdowns and social distancing measures which have encouraged people to take advantage of outdoor transport methods, which pose significantly lower risks of infection compared with transport in closed spaces. The increase of cycling is of particular interest to policy makers in the transition to a more sustainable usage of transport, prompted by the climate crisis, with travel producing no emissions.
This analysis has shown the significant changes in transport usage during the pandemic, highlighting the struggles the public transport industries have faced. With this however has come an opportunity to rethink city spaces and transport usage, in a move in line with government goals to increase the sustainability of the nation's travel.
Olivia Hague is studying a BA in Politics and Sociology at the University of Manchester and is a Q-Step Data Analyst Intern at Opsmorph.


